Among 40 participants in a training, 18 were vegetarians
and 22 were non-vegetarians. 2 participants are selected at random one after another
with replacement of the name of the first selected participant. Calculate the
probability distribution of vegetarians in which the
order does not matter whether the vegetarians are sampled or not in the first
or second draw.
Counting the total and favorable numbers of outcomes
constituting the specified number of objects sampled with replacement from the
finite population is important to calculate the probability of
favorable events. Excel software is commonly available in the desktop or the
laptop and is an important means to calculate the discrete probability
distribution. I take an example from my Statistical Note 17, and will show how
calculate the discrete probability distribution with replacement using Excel
function. Refer to that note for conceptual clarity on using the tree diagram
and formula to calculate the Binomial Distribution probability.
EXCEL Function
Excel software has a ‘Formulas’ tab, which has ‘Insert
Function’ command under ‘Function Library’ group. Select ‘BINOM.DIST’ function
from the list of all function. The ‘BINOM.DIST’ formula has four fields that
look like - BINOMDIST(number_s,trials,probability_s,cumulative) as shown in
Diagram 1.
Diagram 1: Selection of ‘BINOM.DIST’ function in Excel Data Worksheet
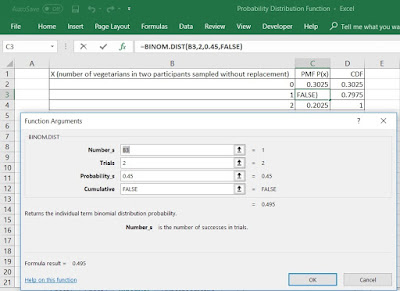
Diagram 2 shows the BINOM.DIST function
arguments using the dataset. The field ‘Number_s’ takes the number of
successes in trials. In this example, this field takes the value from zero to two
vegetarians. Because, in the sample of two participants there could be no
vegetarian, one vegetarian or two vegetarians selected. In this calculation,
one vegetarian in two independent draws of participants has been used as shown
in the cell B3 of the table as well as the
function argument box and the dataset 1 in Diagram 2.
Diagram 2: ‘BINOM.DIST’ Function Arguments
Using Dataset in Excel Worksheet and using ‘FALSE’ logical value in the
field ‘Cumulative’
The field ‘Trials’ is the number
of independent trials. In this example, two participants were drawn
independently and shown in Diagram 2 in the field of the function argument box.
The field ‘Probability’ is the probability of
success on in any individual trial. A probability value lies between 0 and 1.
In this example, 18 out of 40 participants were vegetarians so that the
probability of a vegetarian is 0.45. It is shown both in the field with the
cell number N52 of the function argument box as well as the dataset in Diagram
2.
The field ‘Cumulative’ is a logical value that
determines the form of the function. If ‘Cumulative’ is ‘FALSE’, ‘BINOM.DIST’ calculates
the probability mass function (PMF), which gives the probability associated
with the value assigned to the field ‘Number_s’ as the number of successes. It
is shown in both the function argument box and the dataset with the cell value
N53 in Diagram 2.
Fixing all four fields in the function arguments, ‘BINOM.DIST’
function calculated the PMF equal to 0,495. It means that there is 49.5 percent chance that one of
two participants sampled with replacement will be a vegetarian. This is equal to the value manually
calculated in my Statistical Note 17.
The cumulative distribution function (CDF) is another
important probability calculation. If the field ‘Cumulative’ takes the
value TRUE, the ‘BINOM.DIST’ results in the CDF, which gives the probability up
to the number of successes mentioned in the field ‘Number_s’. In this example,
the probability upto 1 vegetarian selected is the sum of probability of no
vegetarian or non-vegetarian selected in both samples and the probability of
one vegetarian selected between two participants sampled. The logical value
‘TRUE’ is used an shown in both the function argument box and the dataset with
the cell value ‘N53’ that gives the CDF equal to 0.7975 as shown in Diagram 3.
Diagram 3: ‘BINOM.DIST’ Function Arguments
Using Dataset in Excel Worksheet and using ‘TRUE’ logical value in the
field ‘Cumulative’
It means that there is 79.8 percent chance that up to one
vegetarian will be selected in two participants sampled with replacement. This
is equal to the one manually calculated in the Statistical Note 17.
Discussion in this note and my former Statistical Note
17 indicates that both manual and auto calculation produce
the same values and are useful to calculate the discrete probability
distribution with replacement. Conceptual understanding is a backbone and
automatization is efficient. Thus, both are important knowledge and skill sets.
PMFs
and PDFs can be calculated for all number of successes, that is the number of
two non-vegetarians (no vegetarian), one vegetarian and two vegetarians out of
two participants sampled without replacement as shown in tables and argument
functions in both Diagrams 1 and 2.


No comments:
Post a Comment