

The level of confidence for statistical significance varies
with the variation in the sample size of the same sample proportion.
For example, an expert is interested in knowing the
proportion of smokers from the randomly selected sampled respondents. An expert
assumes that half of adult population are smokers. An expert administers a
question to the adults – Are you a smoker? The respondents respond to one of two
categories of response – Yes or No.
An expert tries with a sample size of 100 individuals and
finds that 55 respondents are non-smokers and remaining 45 are smokers. He uses
Chi-Squared test for goodness of fit to test whether the sample proportions of
non-smokers and smokers represent the population proportions, using the formula
for one degree of freedom as below:
Chi-square = Sum(Oi-Ei)2/Ei
where:
Oi = Sampled/ observed proportion for ith
category
Ei = population/ expected proportion for ith
category
Using above formula, an expert calculates Chi-squared value
for 100 samples as:
Chi-square =Sum(Oi-Ei)2/Ei
= (55-50)2/50+(45-50)2/50 = 1
An expert is curious and calculates chi-squared values with the
same sample proportion of non-smokers but with increasing sample size as below:
Table 1: Sample size with Same Sample Proportion of
Non-Smokers, Chi Squared Value and Level of Significance
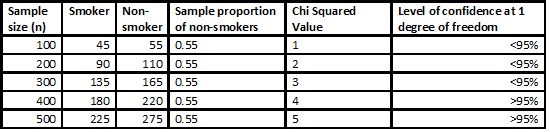
An expert finds that upto 300 samples, an expert is less than
95 confident that the sample truly represents the population and there remains
high sampling error. As the sample size increase from 400 to more, an expert is
more than 95 percent confident and sampling error remains lower. Thus, at least 400 sample size is required for the sample proportion of non-smokers equal to 0.55 to significantly outnumber the sample proportion of smokers (0.45). In other words, 400 respondents need to be sampled for 55 percent non-smokers to significantly outnumber 45 percent smokers.
No comments:
Post a Comment