

Toss a coin 20 times and count the number of heads.
Repeat the same process for seven times or sets each constituting 20 tosses. Calculate
the theoretical and observed discrete probability distributions of number of heads.
Theoretical probability distribution gives an idea of an ideal
probability distribution, what a distribution should be given the parameters. The
observed probability distribution is based on the real-time data and shows how
different the distribution is from the ideal situation. Sampling distribution helps
compare the theoretical and observed distributions.
Tossing of a coin is an example of the two-category discrete probability
distribution of sampling with replacement. Refer to my earlier Statistical
Notes for clarity on calculating the two-category discrete probability using
tree diagram, formula and Excel software function.
Theoretical Discrete
Probability Distribution
I discussed on the Theoretical Two-Category Discrete Probability
Distribution calculation in my former Statistical Note 29. Here, I present only
the table constituting the number of heads in 20 tosses and respective probabilities
(Table 1).
Table 1:
Type and Probability of Outcomes in 20 tosses of a coin

Turning up of 10 head in 20 tosses has highest probability and is thus, highly likely to occur. The likelihood decreases towards both sides of the mean value. Two extreme number of heads, 0 and 20, have the least chance of occurrence.

Turning up of 10 head in 20 tosses has highest probability and is thus, highly likely to occur. The likelihood decreases towards both sides of the mean value. Two extreme number of heads, 0 and 20, have the least chance of occurrence.
The theoretical or the population mean is the product of number of tosses
‘n’ and the probability of head turns up ‘p’. This is denoted by ‘np’, equal to
20 multiplied by half, equal to 10. It means that the mean value has the
highest chance of occurrence.
The population variance is denoted by ‘npq’. Using the values from this
example, the population variance is calculated to be equal to five. The population
standard deviation is 2.2306.
Trial Data
I tossed a coin 20 times in a
sample and the same process was repeated for seven sets or times. Table 2
presents the outcome of 20 tosses of a coin in each of seven sets. Head and
tail were coded one and zero respectively for symbolic representation.
Table 2:
Outcomes in 20 tosses of a coin in each of seven sets (head=1 and tail=0)

To summarize, the number of heads in seven sets ranged from seven, and then nine to 13 (Table 2). This is due to the sampling error. The observed mean number of heads is the sum of the number of heads from each of seven sets divided by seven. This value is equal to 10.43 which is more than the population or theoretical mean equal to 10. It shows the difference between the theoretical and observed means.

To summarize, the number of heads in seven sets ranged from seven, and then nine to 13 (Table 2). This is due to the sampling error. The observed mean number of heads is the sum of the number of heads from each of seven sets divided by seven. This value is equal to 10.43 which is more than the population or theoretical mean equal to 10. It shows the difference between the theoretical and observed means.
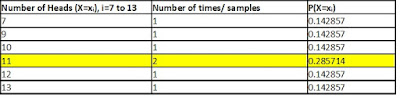
Observed Discrete Probability Distribution
In further
summary, it is noted that 11 heads turned up two times in two of seven sets of
20 tosses (Table 3). Thus, turning up of 11 heads is most likely to occur, two
out of seven times with probability P(X=11)=0.285714. Other five samples had non-repetitive number
of heads that turned up in 20 tosses in each sample.
Table 3: Number of heads out of 20 tosses of a coin
in each of seven samples and probability

Difference between Theoretical and Observed Discrete Probability Distributions
Chart 1 compares the theoretical and observed two category discrete probability distribution of heads in 20 tosses of a coin. This clearly shows the bell-shaped curve, the symmetric line chart of theoretical probability distribution and how different the observed distribution and charts are.

Conclusion
The theoretical two-category probability distribution differs from the observed distribution. The observed data could differ from one set to another because of non-uniformity in the condition in which a coin is tossed repeatedly.
No comments:
Post a Comment